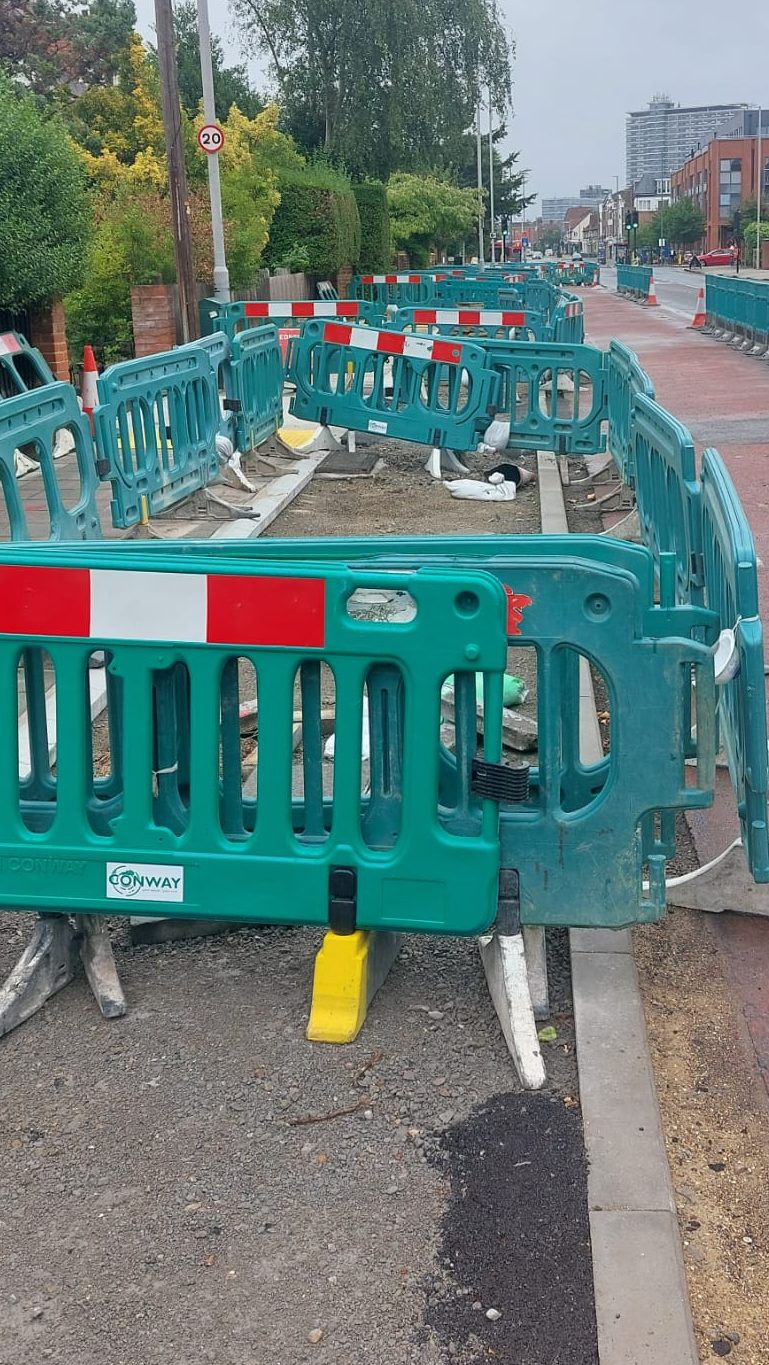
Construction of Cycleways on Ewell Road (Surbiton to Tolworth route) and Kingston Road (Kingston to New Malden route) have been making good progress in 2026! Since our last post at the end of 2025, a large section of the final Ewell Road section has been completed (from Red Lion Road to Worthington Road) featuring:
a new parallel crossing (for those walking and cycling);
an upgrade of a signalled pedestrian crossing to a toucan crossing (so now usable for those cycling too); and
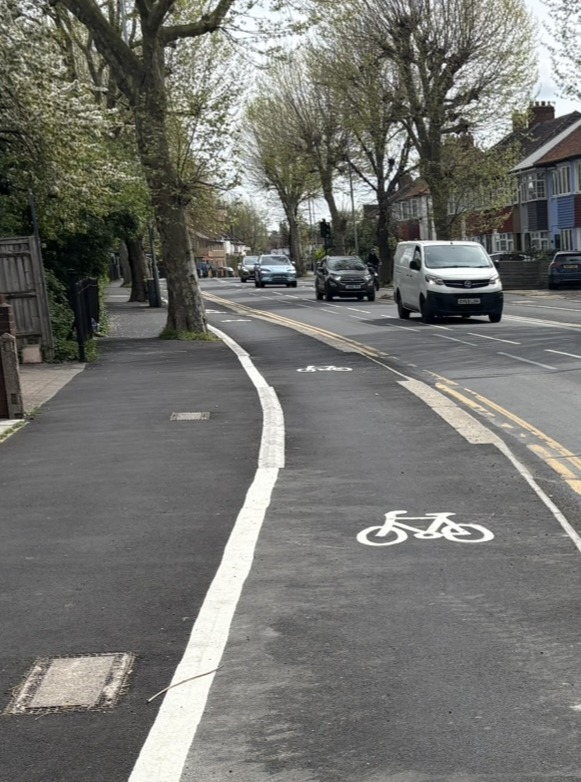
the addition of around 400m of kerb separated cycle tracks in both directions.
The works on Kingston Road are more complex and will continue through to early 2027 (construction phase details here). So far around 200m of kerb separated cycle track have been added in the Kingston direction and around 300m in the New Malden direction. Works continue to complete signage and ‘snagging’ on constructed sections with parking enforcement soon to take place to stop people parking their cars on the new Cycleway!
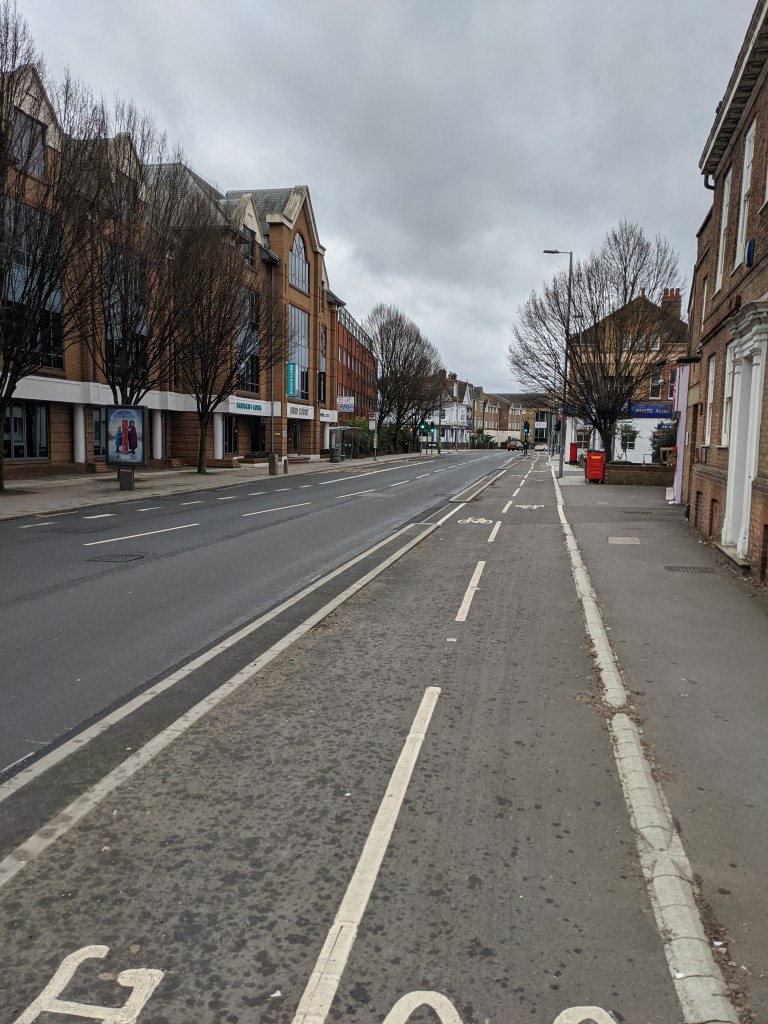
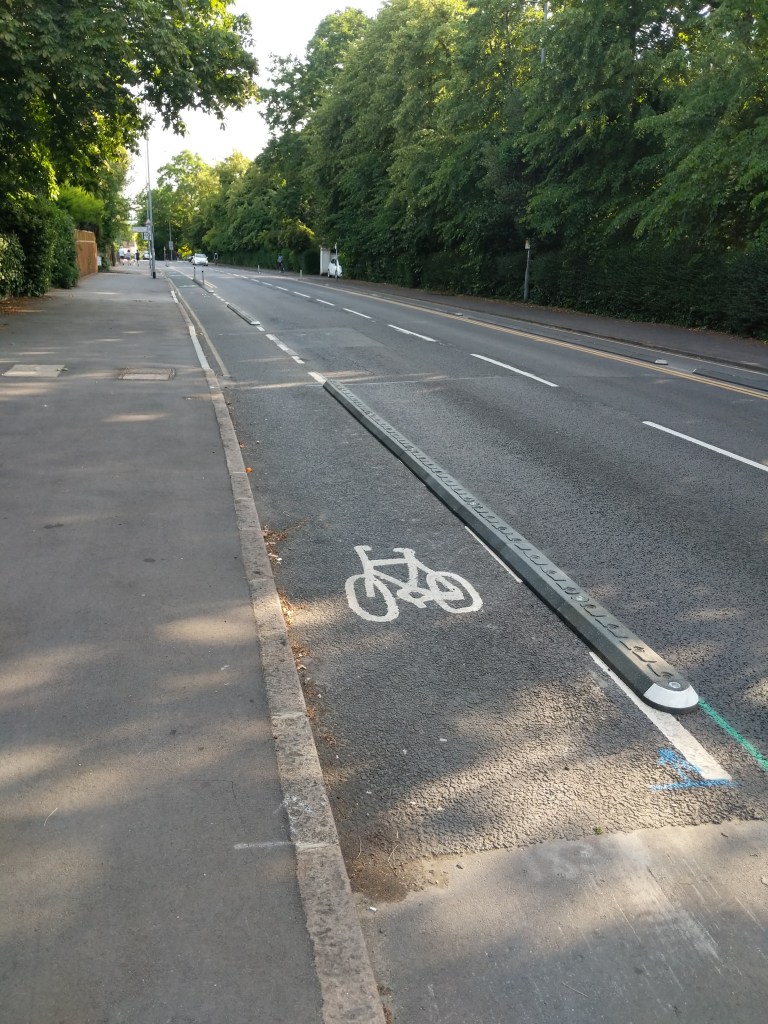
New separated cycle lane on Kingston Road
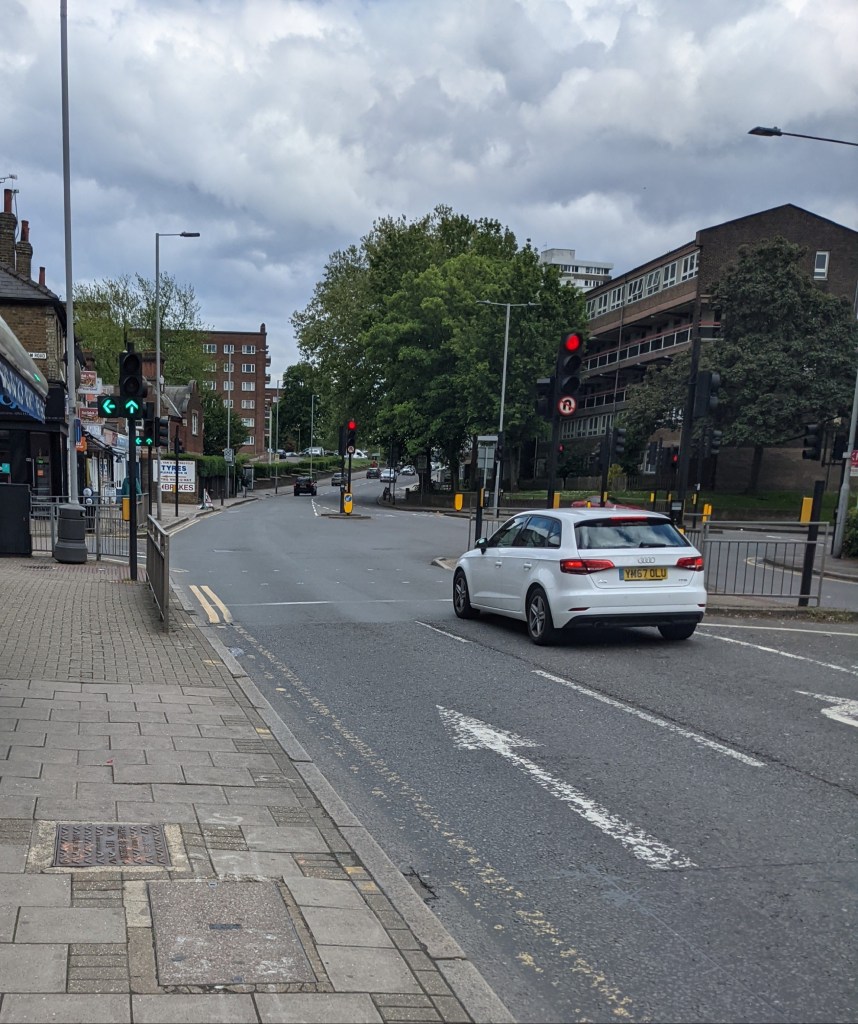
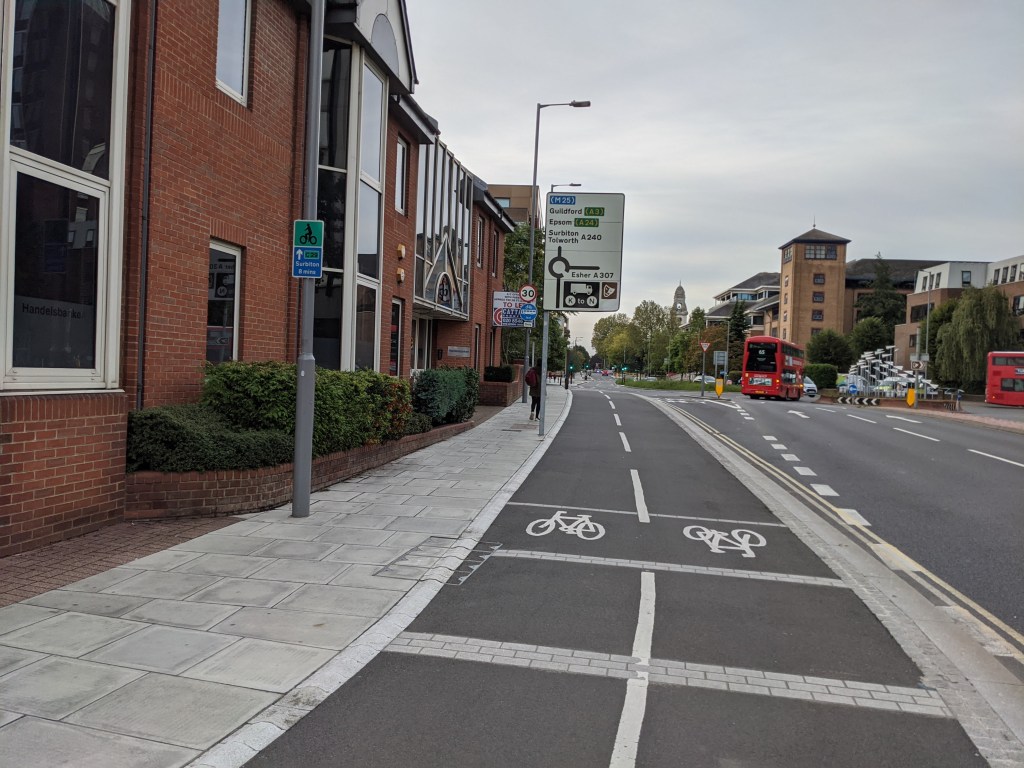
Works still to be undertaken on the Kingston to New Malden route include the junction of Cambridge Road and Hawk’s Road which is currently very difficult and unsafe for people on bikes to use. The changes to this junction will make it easier for people to cross on foot too.
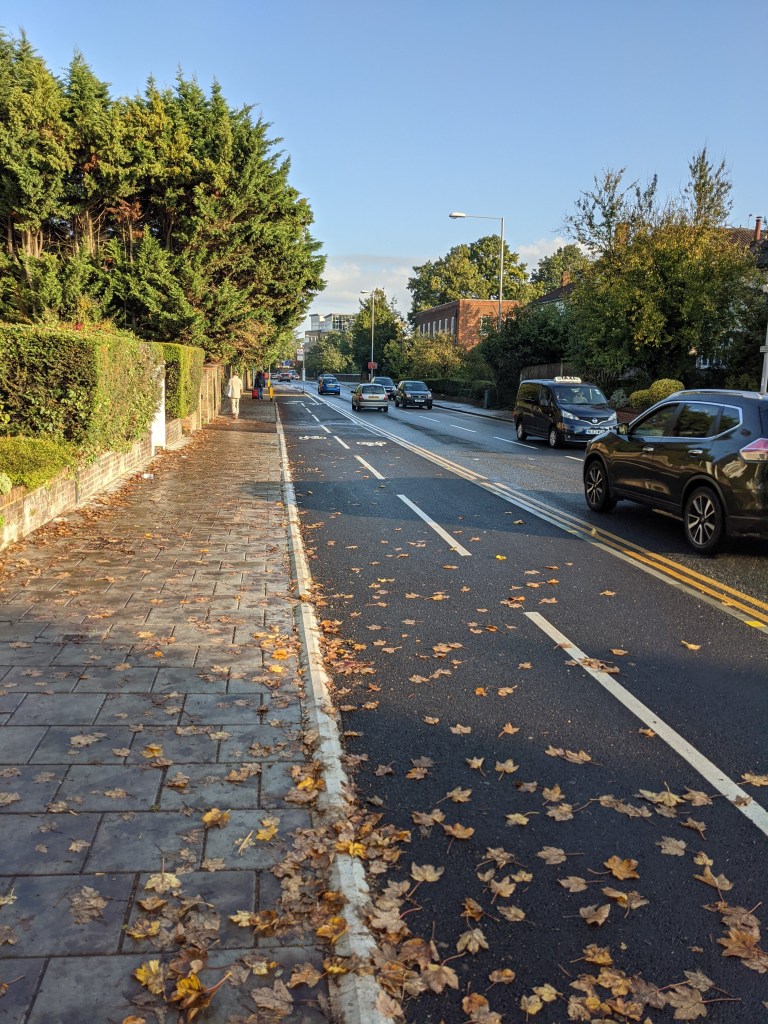
Cambridge Road/Hawk’s Road junction – currently difficult and unsafe to navigate on bike but an upgrade is coming later this year!
We’re also working with the Council to improve sections already completed. If you have any feedback, please let us know!
What comes next?
Works on both schemes will continue for the rest of the year. On Ewell Road, this will include the upgrade of the junction with Elgar and Princes Avenues as well as the section around Kingsdowne/Ditton Road junctions (which should feature separate traffic signals for those cycling).
We continue to campaign for Cycleways to extend to other parts of the Borough. Help us by asking the next Council leader to commit to providing safe cycling routes elsewhere in the Borough – just click here and email them now!
Other links
You can see a map of Kingston’s Cycleway network here.
Following a long pause, construction has restarted to finish two of Kingston’s long planned Cycleways:
Cycleway 29 (Kingston to Tolworth) – construction is taking place to fill in a 600m gap in safer cycling provision along Ewell Road on the Surbiton/Tolworth border.
Cycleway 32 (Kingston to New Malden) – construction of improved cycling facilities has just started on a 1.4km stretch of road along Cambridge and Kingston Roads.
New Cycleway in construction on Ewell Road
Kingston Cycling Campaign are delighted that construction is finally taking place to finish these Cycleways that have been in development for more than a decade. When complete, the Kingston to Tolworth Cycleway will stretch almost 7km from Kingston Station to Tolworth Broadway along a mix of separated cycle paths and quiet roads. Finishing this Cycleway creates the beginning of a Cycleway ‘spine’ route from North to the South of the Borough. It also connects to Cycleway 28 (Kingston High Street towards Long Ditton) and Cycleway 30 (Kingston to Kingston Vale)
Cycleway 32 currently begins from Cycleway 30 near Asda on London Road before ending a couple of hundred metres later along Cambridge Road. When complete, the Cycleway will continue past the Cambridge Road Estate (over 4,000 cycle parking spaces due to be installed as part of its redevelopment), past Kingsmeadow and the proposed new secondary school before ending close to the Fountain junction in the centre of New Malden. Along the way, it also gets very close to the beginning of Cycleway 31 which takes people on bikes (and those walking) along a mostly traffic free route to Raynes Park. Whilst much of Cycleway 32 will include cycle lanes which are separated from other vehicles, part of it will unfortunately involve people cycling sharing a lane with buses. We will be asking Kingston Council to monitor this carefully and to make further improvements if necessary.
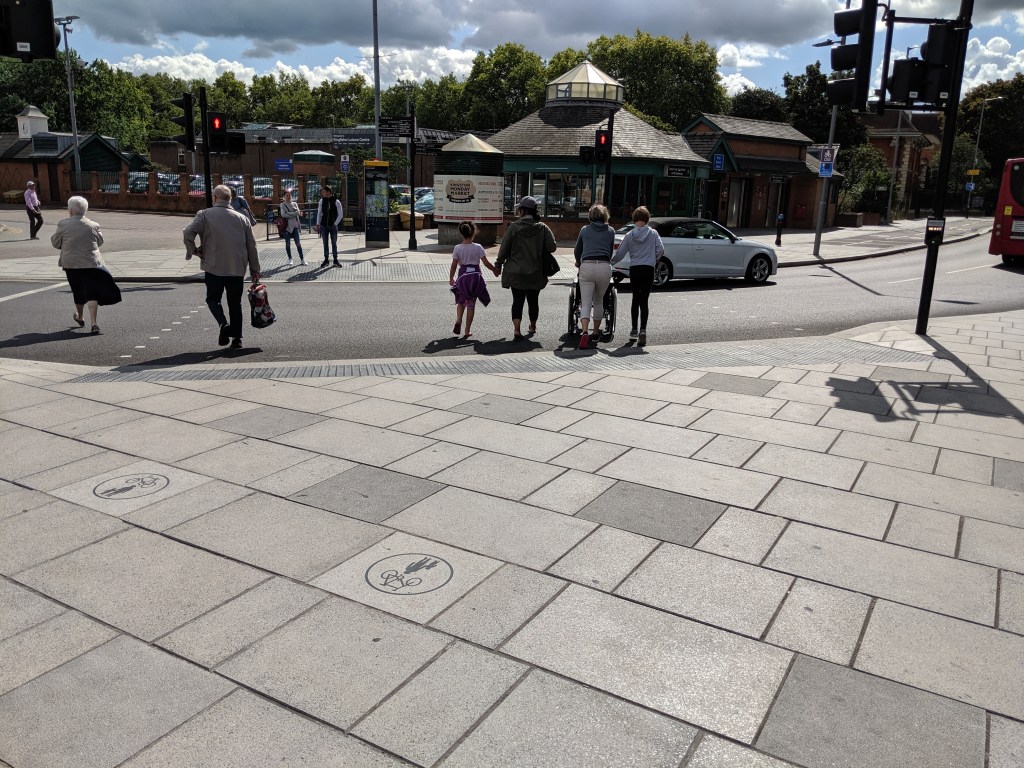
The completed Cycleways will offer improvements for people walking too, with three new zebra crossings to be installed and a crossing at Hawk’s Road junction made easier for pedestrians too. After these have been finished, there will have been 20 new zebra crossings installed along Kingston’s Cycleways so far. Improvements will also be made at some side roads to make it clear that people walking (and cycling) have priority over motor vehicles when crossing the road.
When will the new Cycleways be finished?
Construction on both routes is expected to last until mid to late 2026 with works being planned around other major roadworks in the Borough.
Cycleway construction on Ewell Road
What might be next?
Kingston Council has also applied for funding from Transport for London to commence initial feasibility studies on other potential Cycleways in the Borough. Whilst the original ‘Mini-Holland’ Cycleways will be complete after these works, the network will still not not cover many parts of the Borough including North Kingston (Kingston Station towards Ham), South of the Borough (Surbiton/Tolworth towards Hook and Chessington) as well as to Old Malden and Worcester Park.
Fountain junction in New Malden also remains a dangerous place for people walking and cycling and we hope the Council will take further steps to improve safety there.
In the meantime, Kingston Cycling Campaign will continue working with the Council to make further improvements to the current and planned Cycleways to enhance safety and usability for those on a bike or on foot.
Other links
You can see a map of Kingston’s Cycleway network here.
Whilst the network of Kingston’s new Cycleways delivered as part of the Council’s ‘Go Cycle’ project is far from complete, it’s interesting to see the large number of people who are using the parts of the network already completed.
Although we see lots of people using the network on a daily basis, it is always interesting to have a look at real data to determine actual usage and look for any trends that can be spotted. We have therefore compiled some data from the Council’s existing Cycle Surveys as well as some more recent data produced from Vivacity traffic counting monitors which Kingston Council has been trialling and which we’ve received limited access to.
So, what does the data show us?
New Malden to Raynes Park (Cycleway 31)
This excellent Go Cycle project created brand new walking and cycling paths alongside the South Western train mainline between New Malden station and Raynes Park recreation ground.
Kingston Council’s 2020 cycling survey stated that an average of 320 people were using this route for cycling each day. However, in 2021, The Vivacity sensor data trial shows that 542 people on average used it for cycling (between 14 May and 21 November 2021).
In addition to people using it for cycling, 703 trips by people walking have also been recorded on average each day. Given that before this route opened people couldn’t walk or cycle at all along this path, the data demonstrates how amazingly popular it has become in such a short amount of time.
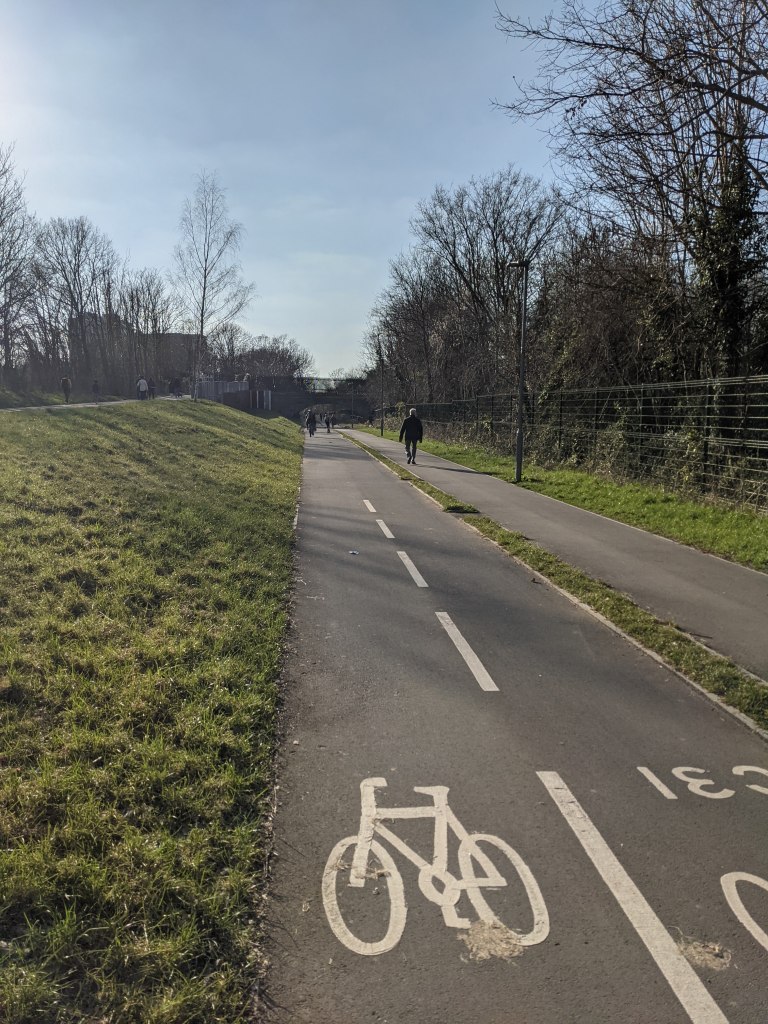
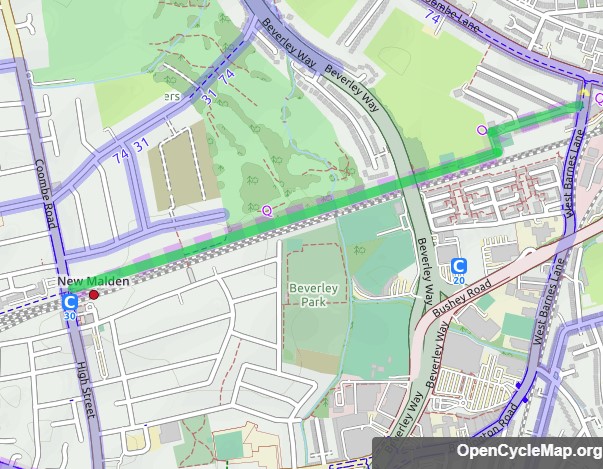
The popular Beeline Way(Cycleway 31)
The popularity of the path is probably helped by it being away from roads meaning it has reduced air and noise pollution compared to alternative routes (for example, via Burlington Road).
Kingston to Kingston Vale (Cycleway 30)
This is the longest end to end Go Cycle project (4.5km) leading from the centre of Kingston to (almost) the Borough boundary with Wandsworth at the Robin Hood junction of the A3.
Despite construction being started in 2018, this Go Cycle route was only completed in full in early 2021 due to Covid related delays. However, parts of the route were open in 2020 and Kingston Council’s 2021 cycling survey stated the number of people using Kingston Hill for cycling was already increasing, with 363 people cycling on the route in 2020 compared to 211 in 2019 (noting that there had been a general increase in cycling in 2020 due to a national lockdown).
There isn’t a Vivacity sensor on Kingston Hill itself, but there is one on London Road near the end of the Go Cycle route by Tiffin School. This sensor shows an average of 1,521 cycling trips using the route a day (between 12 May and 21 November 2021). This compares with an average 15,467 cars being picked up by the sensor each day meaning, in the same year the route was completed, the number of cycle trips on this part of the route has already reached around 10% of the number of cars using the road!
The London Road section of the Kingston to Kingston Vale route (Cycleway 30)
Kingston to Surbiton (Cycleway 29)
This Cycleway was the second major road route to be completed as part of the Go Cycle programme (the first being Portsmouth Road). Unfortunately, this route suffers from many shared areas at junctions (where people cycling and walking mix in the same space), particularly along the Wheatfield Way part of the route. It therefore doesn’t provide direct, uninterrupted journeys for people cycling and its popularity as a cycling route is likely to be harmed as a result. Despite that, the Vivacity sensor on Wheatfield Way shows an average of 462 cycling trips on this part of the route per day (24 June to 21 November 2021) and 652 cycling trips on Penrhyn Road (6 May to 21 November 2021) based on a sensor near the Kingston University building.
A shared area section of Cycleway 29 at the junction of Wheatfield Way and Fairfield North
There is also a Cycleway ‘link’ route along Claremont Road towards Surbiton that connects to Cycleway 29 but isn’t the main Cycleway 29 route. The Claremont Road Cycleway is an indirect route as a decision was made to reroute the Cycleway around The Crescent rather than continuing it along the full length of Claremont Road (which would have required the removal of car parking spaces). The Vivacity sensor here recorded an average of 298 cycle trips per day (6 May to 21 November 2021).
The final Vivacity sensor we’ve seen data for on this route is on St Mark’s Hill though again, this is just a Cycleway ‘link’ and isn’t the main route for Cycleway 29. As with Claremont Road, due to the decision to keep car parking spaces, there is only a segregated cycle path on one side of the road (in the direction up the hill) reducing its popularity for people cycling. The Vivacity sensor here recorded an average of 359 cycle trips per day (6 May to 21 November 2021 (excluding 5 days in June where data recording appears to have failed)).
Surbiton to Kingston via Portsmouth Road (Cycleway 28)
This was the very first Go Cycle route to be built and was completed to a very high standard after Kingston Cycling Campaign successfully obtained improvements to the original plans.
This route features a two-way segregated cycle lane for most of its length and was extended in 2018 to take the two-way segregated cycle path along most of Kingston High Street (though unfortunately it does not yet reach the Ancient Market Place).
Sadly a Vivacity sensor has not been placed on this route so we need to look at data released as part of the Kingston Council Cycling Survey to look at numbers using this route. Helpfully, the 2021 survey provided average cycling figures for 2018-2020 (which we assume are from the automatic cycling counters the Council has installed on this road):
2018 – 1,068 people cycling per day
2019 – 1,114 people cycling per day
2020 – 1,582 people cycling per day
As the survey notes, during the middle part of 2020 there was a large increase in cycling following a national lockdown (the number of cycle trips peaked at 3,891 on a single day during 2020!) so it will be interesting to see if this has increase has been sustained on Portsmouth Road for 2021. In any case, it is great to see an increasing number of people using this safer cycle route.
Is there any other data available for this route? Well, the Department of Transport also compiles traffic counts and has one for Portsmouth Road. Looking at the Department of Transport’s figures we can see an actual (rather than estimated count) was last completed in 2016. Whilst this is a ‘spot count’ (it only counts people using the road on a single day rather than averaging it over a longer period), it shows that there were only 815 people counted cycling using the road on the day the count was taking place out of 15,424 total number of vehicles counted. Compared with that ‘spot day’ and the latest Kingston Council figures, cycling along the route has therefore almost doubled between 2016 and 2020.
As with the Kingston to Kingston Vale route, assuming the total number of vehicles using Portsmouth Road has remained broadly steady since 2016, the number of people cycling on the route could again be around 10% of the total vehicles using the road!
Portsmouth Road – Cycleway 28
Any other data?
Some other quick statistics:
1,370 walking or cycling trips on average per day across the new bridge taking people over the one-way system near Kingston Station (25 June to 21 November 2021 – Vivacity sensor data). Given this route was closed for over two years and only reopened earlier this year it’s already proving popular and allows for many more people to use it than the bridge it replaced.
421 cycling trips on average per day using the South Lane underpass to cross the A3. This is one of the few safe and convenient crossings of the A3 in this area (6 May to 21 November 2021 – Vivacity sensor data).
Only 394 cycling trips per day on average on Coombe Lane West (2 May to 21 November 2021 – Vivacity sensor data). This route was removed from the first phase of the Go Cycle programme and therefore lacks segregated cycling facilities. This is despite it being a major desire route for cycling between Norbiton and Raynes Park. It also passes a number of current (and planned) schools as well as Kingston Hospital. We hope that Kingston Council will be successful in their funding bid for Go Cycle phase 2 which provisionally includes this route. Coombe Lane West could then see an improvement in cycling rates as seen on the Go Cycle phase 1 routes already constructed.
More Department for Transport data suggests that, as mentioned earlier, there was a large increase in cycling nationally during the middle part of 2020 following a national lockdown. However, nationally, the data states that cycling levels in 2021 have broadly returned to those at the beginning of March 2020. The apparent increase in people cycling in Kingston during 2021 is therefore even more impressive.
What does all this data tell us?
It is important to emphasise that the Vivacity sensors are under trial and the figures used above have not been audited. However, the Vivacity sensors do seem to pick up a similar number of vehicles per day as shown in other recent Council traffic counts which use different technology. A trial of these sensors elsewhere in London also showed they were up to 97% accurate.
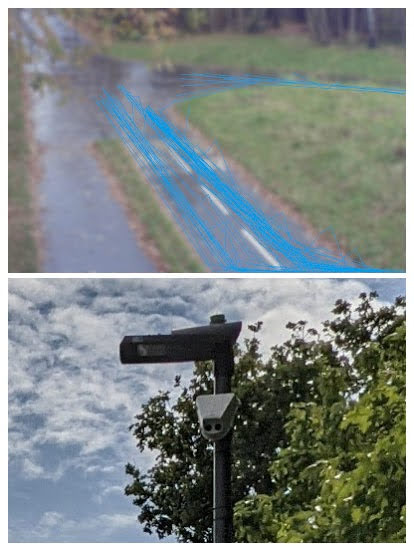
It is also interesting that the sensors can pick up ‘tracks’ of vehicles so can see what paths they are taking and which turns they make (see photo below). These images could help more easily determine the origin and destinations of journeys as well as helping understand whether people find the new cycling infrastructure useful or if they are avoiding it and are using the road instead.
Vivacity sensor image showing cycling ‘tracks’ along Beeline Way during a one hour period on 23 November 2021 and a picture of the sensor on a nearby lamppost
We look forward to hearing the results of the full trial of the Vivacity sensors and hope the Council will keep those in place on the Go Cycle network as well as filling in gaps in their coverage on the remainder of the network.
The data seems to show that the New Malden to Raynes Park has been very successful and also, that where there is continuous high-quality segregated cycle routes, e.g. Portsmouth Road and London Road, that cycling rates can be a substantial portion of the total number of vehicles using the route. However, where there are gaps in segregation for people cycling, for example Wheatfield Way, cycling rates seem to be lower. We therefore hope this data gives Kingston Council the drive to look at improving the continuity of exiting Cycle routes to provide direct and segregated routes, even through junctions.
Overall, the numbers of people cycling on the Go Cycle routes seem to be increasing. However, with Phase 1 of the Go Cycle network still not complete and Phase 2 currently unfunded, it will be some time before everyone in the Borough lives next to a safe cycling network. Until that happens, cycling levels in the Borough are unlikely to reach their full potential.
Firstly, after some uncertainty, we were very pleased to find out in February that Transport for London (TfL) had awarded Kingston Council outline funding to complete the last link in the Mini-Holland programme, the Kingston to New Malden Cycleway. The funding from TfL was significantly reduced from that originally budgeted so some of the work has been scaled back but it will still be a significant improvement for cycling compared to the current state of the route. See below for more on how that scheme is getting on now as well as updates on the other schemes that have made further progress this year.
Kingston Station
In April 2021, one of the most visually striking parts of the Mini Holland programme opened with a new four metre wide walking and cycling bridge taking people from Kingston Station the Kingston one-way system towards the river and Ham. This bridge replaces a very narrow bridge and has created a much more pleasant route from Kingston Station towards the Thames, Canbury Gardens and for people heading to Kingston Bridge.
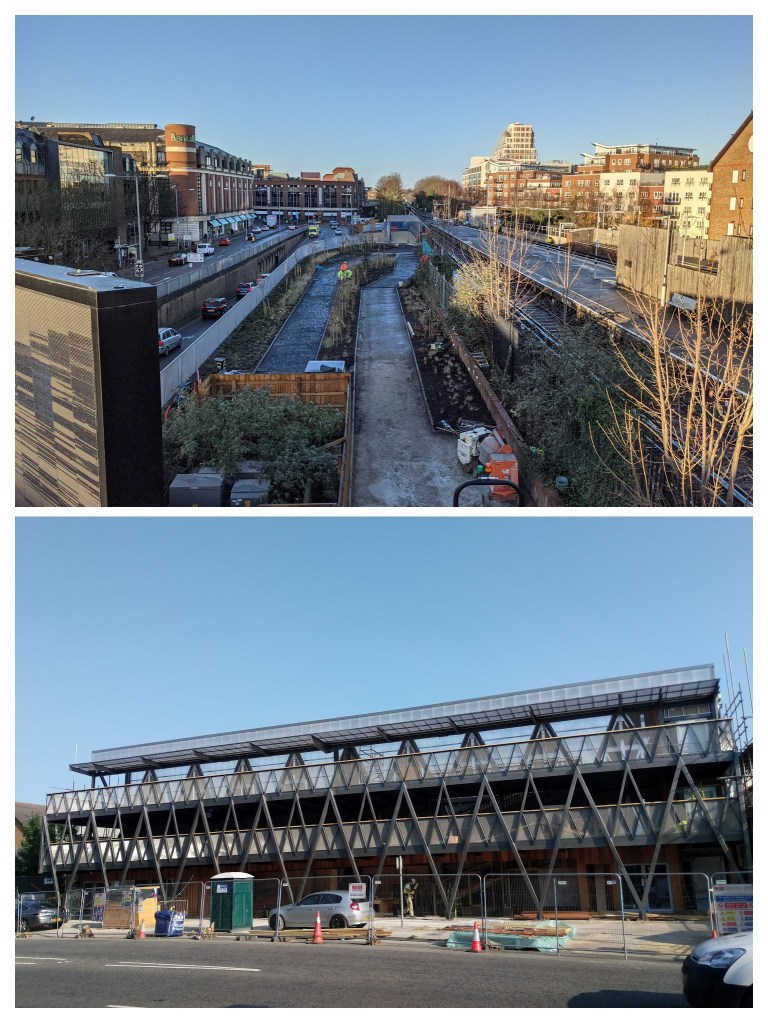
Photos of the new bridge next to Kingston Station and the bridge it replaced
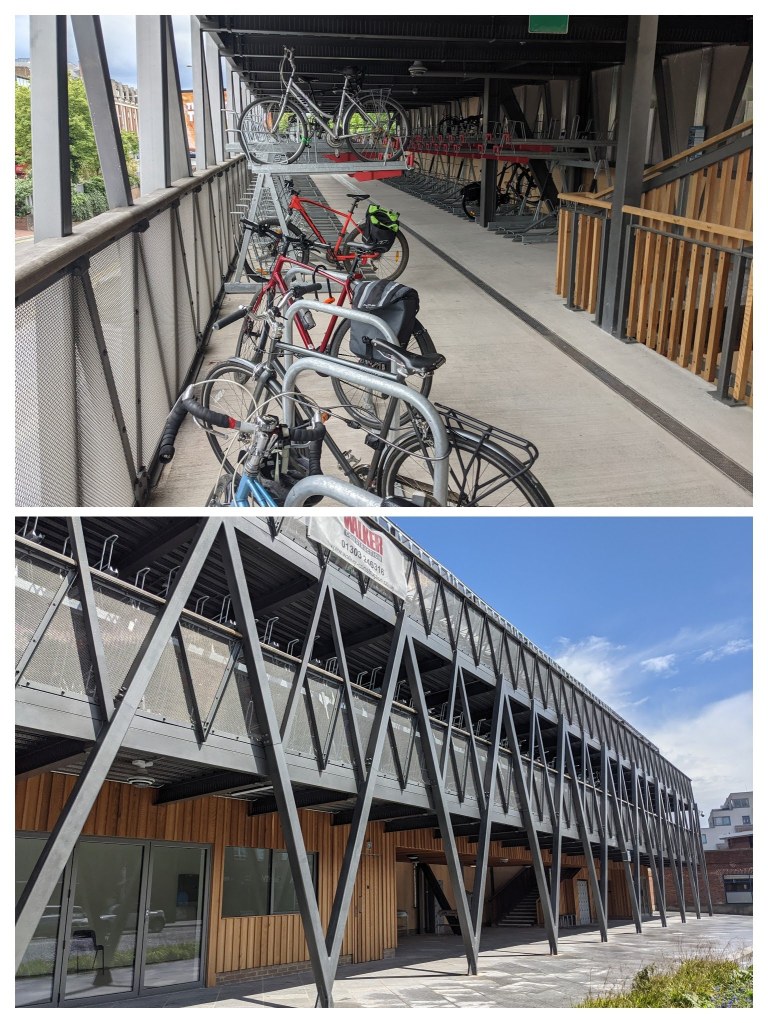
The other big milestone for the Kingston Station Mini-Holland scheme was the opening of the 424 space bike storage hub (official opening date was 25 May 2021). This storage hub has free access to bike tyre pumps, bike maintenance stands with tools, a water fountain, lockers, many CCTV cameras linked to Kingston Council’s CCTV centre, a spacious lift to the first and second floors and space for non-standard bikes too. There is also space for a cafe and bike mechanic on the ground floor. Whilst Kingston Station is not at pre-Pandemic usage levels being used very much at the moment, we’ve already noticed that the bike hub is being used for people visiting the city centre. Whilst we would have been interested in some of the bike spaces being even more secure (for example, only accessed with a swipe card) as well as more signage (which hopefully is to come!), we hope it will be a valuable resource to Kingston’s residents and visitors.
Photos of the new Kingston Station bike hub which has capacity for 424 bikes
Surbiton to Tolworth
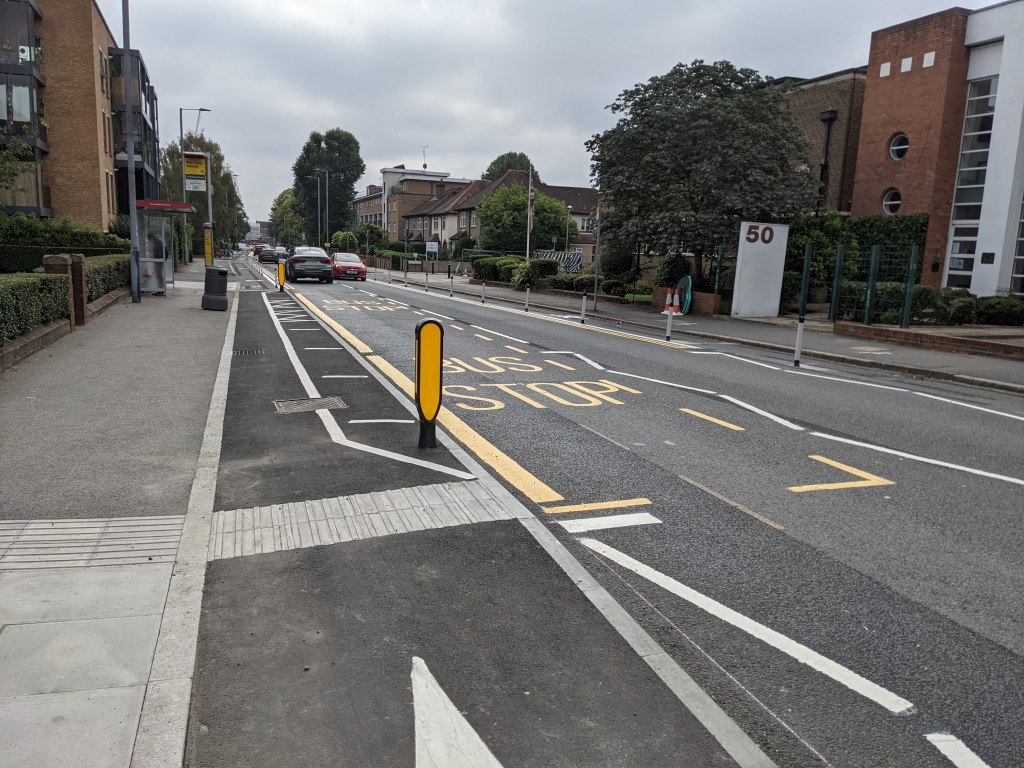
The Surbiton to Tolworth Cycleway along Ewell Road started construction at the beginning of 2020 before being delayed due to Covid. Phase 1 (St Mark’s Hill to Browns Road) was completed last year before Phase 2 (Browns Road to Tolworth Broadway) was paused so that the original designs could be re-worked (again, to fit within reduced budgets from TfL). Phase 2 is now under construction and, to fit in around roadworks required for gas main upgrades, started at the Tolworth Broadway end of Ewell Road. The first sections of protected cycleway have now been finished between Tolworth Broadway and the Elgar/Princes Avenue junction on Ewell Road. Work is now taking place on Ewell Road near the junction with King Charles Road and Red Lion Road. Over the next c.6 months, work will continue along Ewell Road, joining up with the completed Phase 1 at Browns Road.
Construction of the Surbiton to Tolworth Cycleway continues with this ‘bus stop bypass’ being built near King Charles Road/Ewell Road junction
When this Cycleway is complete, and combined with the new bridge by Kingston Station (as well as the trial Low Traffic Neighbourhood on Lower Ham Road), there will be a c.7km safer cycling route all the way from Kingston’s border with Richmond upon Thames (at Ham Cross) to its border with Epsom & Ewell (near Tolworth)!
Kingston to Kingston Vale
The longest individual Mini-Holland scheme, at almost 4.5km in length, was completed earlier this year with the final works happening on Kingston Hill at its junction with Galsworthy Road and also Queen’s Road. Changes were also made earlier this year at the Kingston Vale end of the route near the A3.
Named Cycleway 30, we’ve already noticed a large increase in use with a large variety of bikes making an appearance. We’ve seen tandems (including side-by-side tandems!), bikes with trailers, specially made cargo bikes as well as the usual variety of road, hybrid and mountain bikes with people of all ages using the Cycleway to be active, reduce air pollution and best of all, skip the queues of motor vehicles!
All types of bikes can be found using the new Cycleway network in the Borough
We’ve been speaking with the Council to try and get a number of improvements made to the Kingston to Kingston Vale Cycleway to make it even better to use. This includes converting a zebra crossing between Warren Road and Ladderstile Rise to shared use to assist people on bikes with getting to Richmond Park more easily. We’ve also raised issues with some of the signage – particularly around Manorgate Road roundabout, we think some of it is unclear and confusing and we’d like it changed. Whilst budgets are tight, we don’t have any promises that these changes will be made but will continue campaigning to get these (and other) changes made to make the route the best it can be.
In a very recent update, Councillor Olly Wehring has announced that the Council are looking into improving safety at the Birkenhead Avenue/London Road junction on the Kingston to Kingston Vale Cycleway. This busy junction interacts with a 2-way cycleway and we’ve had many reports of near-misses at this junction since it was rebuilt in mid-2020. The danger is caused by Birkenhead Avenue being used by a lot of cars to avoid the one-way system. Keeping cars to the main A-roads (which have 3 to 4 vehicle lanes here and are designed for large volumes of traffic) would make this junction safer. We look forward to seeing further details of what is proposed.
Kingston to New Malden
As per the beginning of this update, funding for the Kingston to New Malden Cycleway was confirmed by Transport for London in February. Kingston Council didn’t take long to start work on the ground with work starting at the Cambridge Road end of the route to join with Cycleway 30 (Kingston to Kingston Vale) at its junction with London Road near Asda.
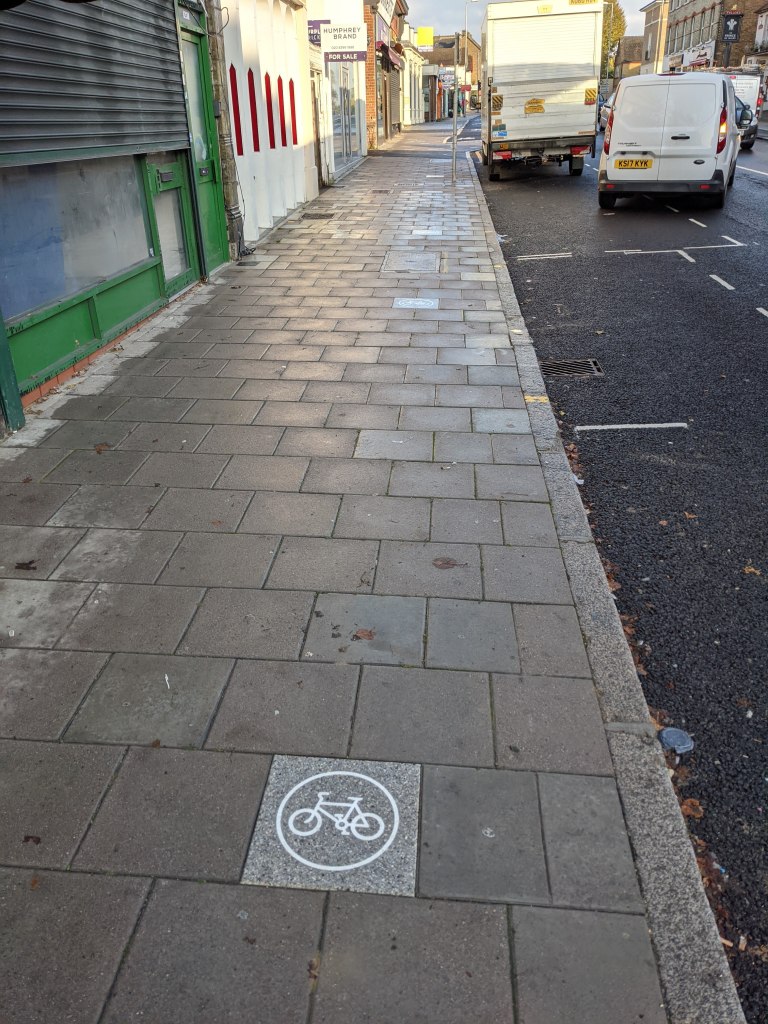
The first work completed included preparations for a brand new zebra crossing across Cambridge Road making it easier and safer for people to cross the road (this is the 14th new zebra crossing that has been introduced as part of the Mini-Holland programme) as well as resurfacing and kerb works for the two-way Cycleway which will be introduced on Cambridge Road between Hawk’s Road and London Road.
More recently, work has continued at the other end of the route near New Malden with the creation of another new zebra crossing (the 15th!), new ‘bus boarders’, and the installation of poles (or ‘wands’) separating people cycling from cars, buses and lorries.
New bus boarder on the Kingston to New Malden route with ‘wands’ separating people cycling from cars on the opposite side of the road
We were also pleased to see the access to this improved cycle route from Chatham Road amended to make it easier for bikes to pass around an old fire gate (though it’s still not quite wide enough for all types of bikes (e.g. cargo/adapted bikes) so it will stay on our list of improvements we’d like to see).
What’s coming up
As above, Surbiton to Tolworth (Phase 2) and Kingston to New Malden are currently in construction and this will continue for the rest of the year and into the beginning of 2022.
In the meantime, we will also try and get things improved on routes where main construction has ended and in particular, will be asking the Council to get signage improved on routes that have now been completed
We will also continue to campaign for more funding for the Cycleways network to be extended to other parts of the Borough too. Although completion of the Mini-Holland schemes will mean around there’s around 17km of new, safer Cycleways in the Borough, there are still parts of the Borough that will still be a long way from this upgraded network (e.g. Old Malden/Worcester Park and most of Chessington and Hook).
As a very final note, the extremely successful and popular New Malden to Raynes Park Cycleway, starting next to New Malden Station, has been named ‘Beeline Way’ following a public vote.
How you can support us?
If not already a member, why not consider joining London Cycling Campaign and benefit from discounts, 3rd party liability insurance, free legal advice on cycling matters, as well as adding your voice to our campaign for safer cycling throughout London. You can join using this link: https://www.lcc.org.uk/membership/
You can also contact us with any thoughts or comments
If you live locally, you could also contact your Local Councillor with details of any improvements you’d like to be made for cycling in your local neighbourhood.
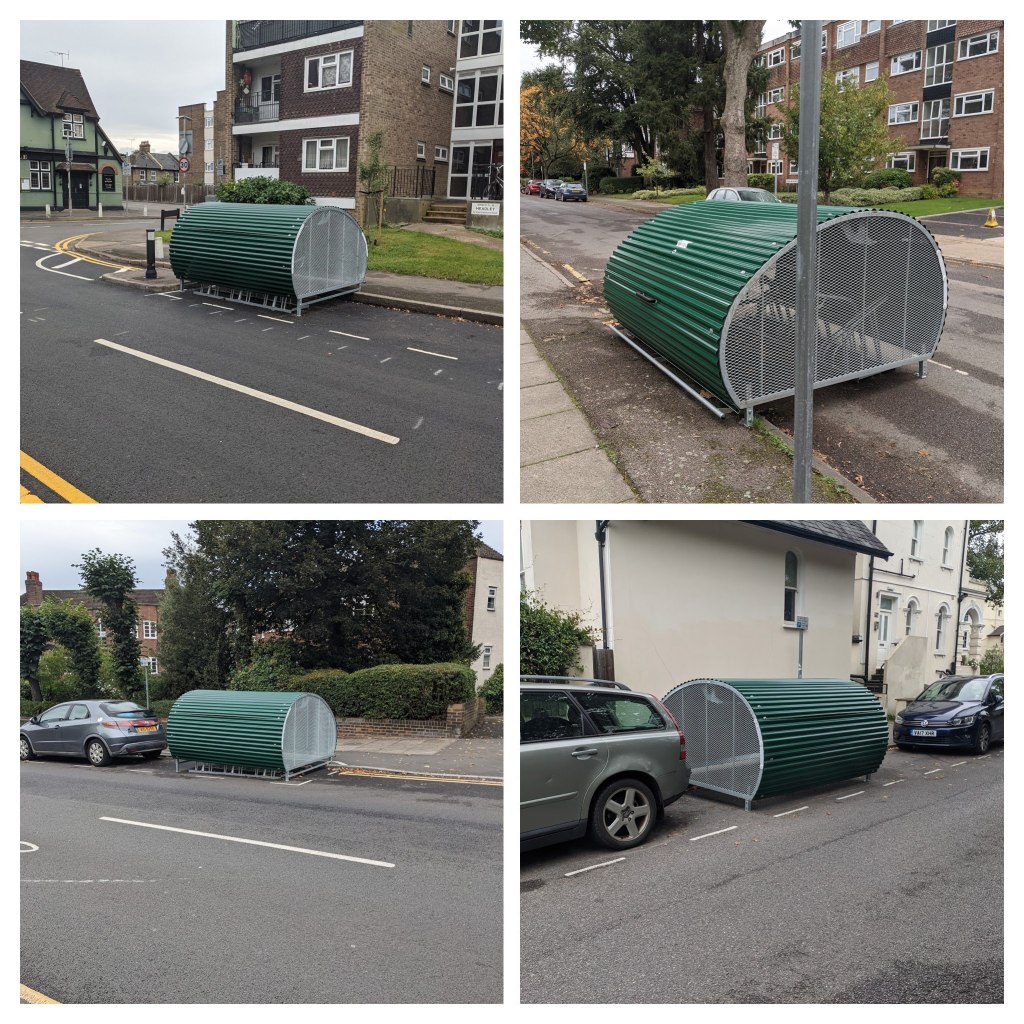
16 new Secure Cycle Hangars are now appearing in streets across Kingston and Surbiton after Kingston Council obtained funding for their installation from Transport for London.
Each of these Cycle Hangars allows six bikes to be securely stored on the street with the hangar taking about half the amount of space a car would take. Each person who hires one of these spaces will receive secure access to the Hangar and can store their bike there for as long as they keep hiring the space. Cycle Hangars have been in place for many years on some of Kingston Council’s housing estates so it is great to see Hangars now being installed on the borough’s streets.
Find out where the Cycle Hangars are being installed, their likely cost and how to register for them below.
Four of the new Bike Hangars installed in the Borough
Why are Cycle Hangars so useful?
Many people do not have space in their home (including lots of those who live in flat conversions) so these new Cycle Hangars will allow many residents the opportunity to store a bike securely for the first time. This will support an increase in bike ownership in the Borough and therefore help more people to cycle.
Encouraging more cycle use is essential to help the Borough’s air quality problems, reduce congestion and assist the Borough’s residents with becoming more active.
The Cycle Hangars are very efficient use of street space as six bikes can fit in less than the space needed for a single car.
Where are the Cycle Hangars being installed?
The Cycle Hangars have been installed on the following roads:
Adelaide Road, Surbiton
Anglesea Road, Kingston
Berrylands, Surbiton
Cadogan Road, Surbiton
Claremont Road, Surbiton
Elm Road, Kingston
Grayham Road, New Malden
King Charles Road, Surbiton
Lovelace Road, Surbiton
Maple Road, Surbiton
Oakhill Crescent, Surbiton
Princes Road, Kingston
St Andrew’s Square, Surbiton
St Mark’s Hill, Surbiton
Surbiton Hill Park, Surbiton
The Avenue, Surbiton
Windmill Rise, Kingston (not yet installed)
A map produced by Kingston Council of all the new cycle hangars is below:
How much will the Cycle Hangars cost?
If the Council do not subsidise the cost of renting a space in the hangars, we understand that the annual charge will be about £70 for the hire of one space in a Cycle Hanger. This will cover the maintenance and administration of the Hangars.
How do I get a space in the Cycle Hangars?
The Council has published this web page with details of how to register an interest in a Cycle Hangar space. We understand that they will be available to use from December 2021. We will update this page once we know more.
Why isn’t there a Cycle Hangar on my road?
If you would like a Cycle Hangar on your street but your road isn’t on the list above, why not contact your Local Councillor or the Sustainable Transport team to ask when Kingston Council will be installing more? Ask your neighbours if they would be interested as well and get them to contact the Council or Councillors too. The greater demand that is shown for the Cycle Hangars on your street, the higher likelihood that more will be installed!
Though it is great that Kingston Council is installing these new hangars, nearby Wandsworth are installing 111 Cycle Hangars over the next year whilst Waltham Forest now has around 500 Cycle Hangars. New Malden is only receiving one Cycle Hangar of the 16 new ones being installed with none due to be installed in Tolworth or South of the A3. Kingston Cycling Campaign will therefore continue to campaign for more Cycle Hangars to be installed in the Borough as well as making sure other types of cycle parking are improved.
Kingston Council ran a Borough wide consultation in early January/February 2020 proposing to make the Borough’s roads safer by introducing a 20mph speed limit on all residential roads. Due to Covid, the outcome from the consultation was delayed and has only recently reached Kingston’s four neighbourhood committees.
Whilst many have been focussing on the Euros championship in the past couple of weeks, we’ve instead been closely following the result of the neighbourhood committees and how they have voted on the further roll-out (or otherwise) of 20mph limits in their area. We’ve set out below what has been decided and what might happen next but before we kick-off, a quick reminder of why the Council wanted to introduce 20mph speed limits:
There are three main reasons why the council feels 20mph would be great for our roads:
Improved air quality: by lowering and evening out acceleration.
Fewer casualties: lower speeds give drivers and others more time to react.
Better health: more people walk and cycle, as they feel safer.
There is also evidence from other areas of the UK that shows a reduction in average speeds when area-wide 20mph is introduced, even if there is no enforcement or traffic calming measures in place.
What’s been decided?
Kingston Town Neighbourhood (Tudor, Canbury, Grove, Norbiton wards) – decided to introduce 20mph limits on a handful of additional roads near Sainsburys (Sury Basin). Prior to the final vote, an amendment was proposed by Cllr Wehring and seconded by Cllr Tolley. This amendment would have extended 20mph limits to a number of additional roads (Portsmouth Road, Queen Elizabeth Road, Cromwell Road, Wood Street, Horse Fair, Tudor Drive, Coombe Road (junction with Wolverton Ave to London Road)). However, the amendment fell after the vote was split evenly (plus one abstention) with the chair of the committee making the casting vote to block the amendment. The committee also agreed that residents may be consulted in the future (on an undetermined timeframe) if they would like 20mph limits on their roads (which roads these might be is not specified…). KCC Summary – Kingston Town started at the top of the table (currently 70% of roads have 20mph limits in the neighbourhood) but will be overtaken by Surbiton’s plans (see below). Losing the amendment after extra time means Kingston Town goes home with little to show for it despite some excellent shots on target by some of the Councillors present.
Maldens & Coombe Neighbourhood (Coombe Hill, Coombe Vale, St James, Beverley wards) – Disappointingly there will be no immediate extension of 20mph limits anywhere in the Maldens & Coombe neighbourhood. Though again, residents on specific roads (unnamed) will be consulted in the future (no specific timeframes) on whether they would like 20mph limits on their roads. KCC Summary – nothing can hide the disappointing result from this committee – there were few attempts on the target (of making roads in the neighbourhood safer) here with supporters leaving before the final result as it seemed to be clear that a win wasn’t going to be forthcoming this night.
South of the Borough Neighbourhood (Tolworth & Hook Rise, Chessington North & Hook, Chessington South wards) – As with Maldens & Coombe, there will be no immediate extension of 20mph limits on roads fully within the South of the Borough despite only 36% of the neighbourhood’s roads currently having 20mph limits. However, the committee voted to commit highways officers to investigate reducing the speed limit on roads which currently have speed limits in excess of 30mph in the neighbourhood. This means that part of Jubilee Way could reduce from 40mph to 30mph and parts of Rushett and Fairoak Lanes could reduce from 60mph (the only 60mph roads anywhere in the Borough!) to 40mph. In addition, the committee voted to allow Red Lion Road and Herne Road (and, by implication, Thornhill Road) which are shared with Surbiton neighbourhood, to change to 20mph if Surbiton neighbourhood voted for this (which they did). The neighbourhood has also committed to consult (without specified timeframes) with specific roads (which, spot the theme, are unnamed) in the future on whether they would like 20mph limits introduced. KCC Summary – again, a disappointing result but with a small silver lining of following Surbiton’s decision on moving to 20mph shared roads and looking into reducing the speed limit on roads with a limit of 40mph or above in the neighbourhood. Room for improvement in future outings.
Surbiton Neighbourhood(Alexandra, Berrylands, St Marks, Surbiton Hill wards) – After an amendment proposed by Cllr Sumner and seconded by Cllr Green, Surbiton neighbourhood committee voted unanimously to introduce a 20mph speed limit on ALL Borough controlled roads within the neighbourhood boundary. Highways officers have also been asked by the committee to ask Transport for London to consider lowering the speed limit on the A240 as well as the A3 slip roads which are in TfL’s control (the A3 itself wasn’t included in this request). KCC Summary – full roll out with unanimous support, clearly had eyes focussed on the goal (of safer streets) resulting in being the standout neighbourhood champions. All Surbiton neighbourhood Councillors should be proud of the part they played in the result. Other neighbourhoods look on at what might have been.
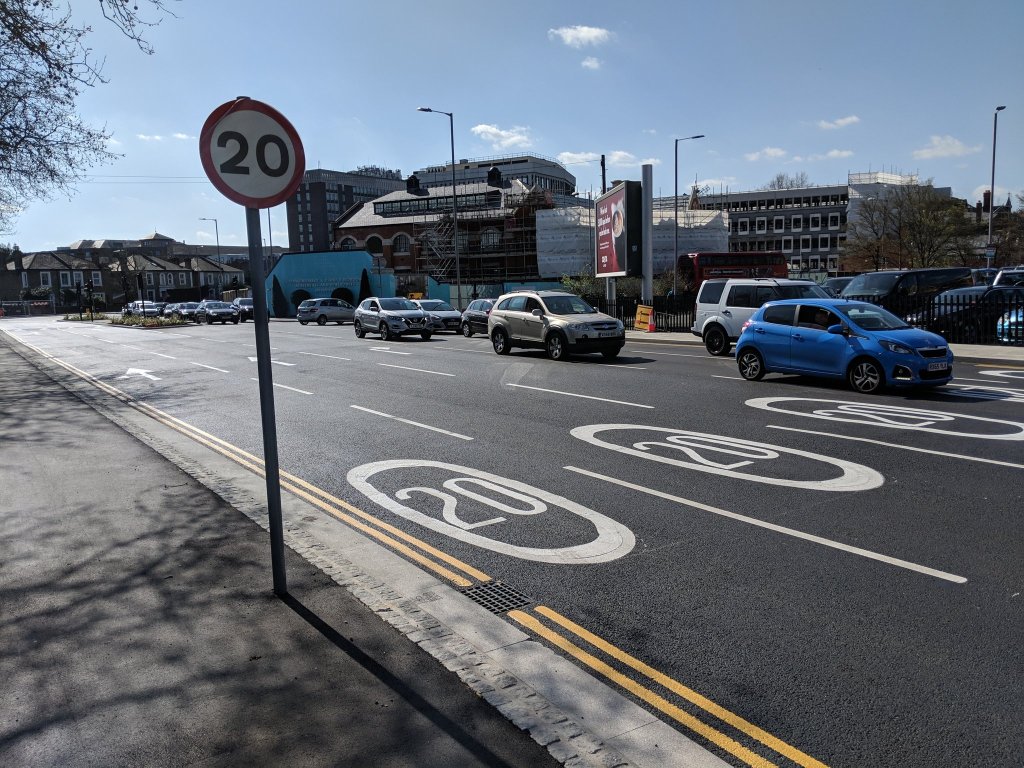
Existing 20mph limt on Wheatfield Way in Kingston Town neighbourhood. Introduced as part of the Go Cycle improvements.
What’s next?
Surbiton neighbourhood is clearly leading the way in introducing comprehensive 20mph limits in the Borough by committing to rolling out this limit to all of the roads controlled by the Borough in its area. Traffic orders will now need to be prepared by highways officers and it is likely these will go to committee again in September for final approval. We’d hope the 20mph limits could then roll out by early 2022. This is also the likely process for the handful of roads in Kingston Town that are proposed to move to 20mph. The timings for a review of the roads in South of the Borough which currently have a speed limit of more than 30mph is uncertain.
What about roads which are not going to be 20mph? Well, this is where it gets very unclear. None of the (non-Surbiton) committees discussed this in detail though it was mentioned in one committee that residents could create petitions for their roads to move to 20mph. The problem with petitions for this are:
that it will require residents to be organised and know about the ability to petition for safer streets
it will require time to be scheduled at a neighbourhood committee to discuss the petition
it will require a traffic order for each set of proposals agreed
is more expensive than making a wider 20mph limit (as officer time will be required to assess each petition and the roads contained with the petition, more traffic orders are likely to be required and additional boundary signage will also be needed)
Unfortunately Transport for London is currently in the middle of cut-backs and has reduced grants to local Councils (including Kingston). Kingston Council also does not have a strong track record of investing additional sums in Healthy Streets initiatives beyond those given to it in grants from Transport for London or from funds from developers. This means that any future extension of 20mph limits beyond those agreed in recent Committees could be some time away.
Kingston Cycling Campaign is a strong believer in 20mph limits being an important step in creating safer roads and we will therefore continue to campaign for the rest of the Borough’s roads to move to 20mph. As per the consultation documents, 20mph roads are safer (lower speeds reduce the number of collisions and when collisions do happen their severity is reduced too), they encourage more people to walk and cycle and can also reduce air pollution as less acceleration/braking is required.
All local Councillors were given the opportunity to vote on the roll-out of 20mph limits in their neighbourhood. If you therefore share our disappointment in the outcome of the 20mph consultation in three of the neighbourhoods (or if you live in Surbiton neighbourhood and want to congratulate someone!), why not let your local Councillor know?
How to find out more about 20mph
Transport for London map showing all the speed limits in London. This shows the widespread 20mph roads (green) in neighbouring Richmond, Merton and Wandsworth. Kingston shows lots of blue (30mph) roads. Only the roads in Surbiton neighbourhood are likely to have significant changes on this map for the Borough of Kingston in the next 12 months.
20sPlenty website – want to find out more about the benefits of 20mph limits – here’s the site!
Kingston Council 20mph consultation – want to find out more about the original Borough consultation together with maps of all the collisions resulting in injuries on Kingston’s roads in a 5 year period – this is where you’ll find them.
Current Kingston 20mph speed limit map – want to see which roads are currently in 20mph and what the average speed of vehicles on roads near you are, helpfully, Kingston Council has the map for you.
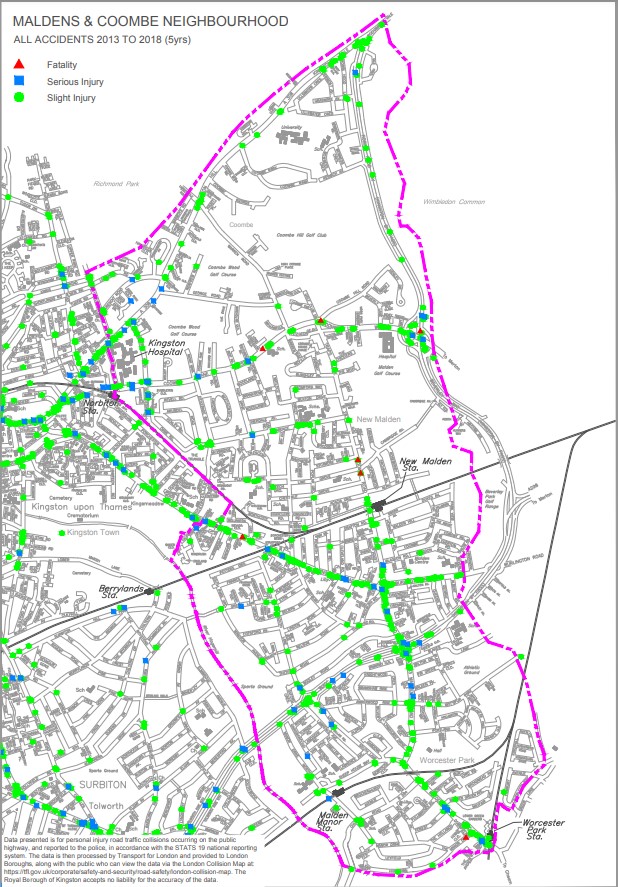
Malden and Coombe – map of all collisions causing injuries (and deaths) in a 5 year period on the local road network. The cluster of injuries (and deaths) on main roads show why 20mph limits are required on all roads in the Borough
As a decision by the Council on Kingston’s three Low Traffic Neighbourhood (LTN) trials approaches, Kingston Cycling Campaign has been undertaking research into the history of LTNs in Kingston.
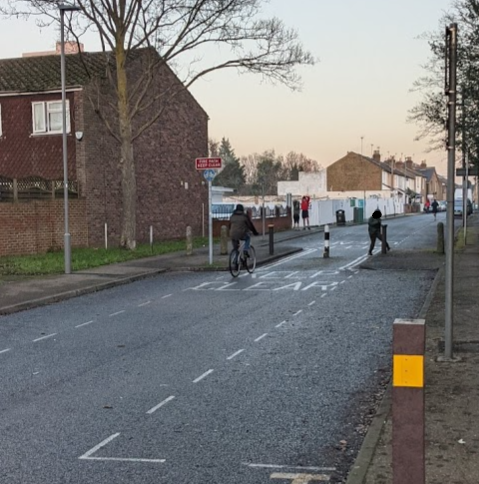
Our research has found that LTNs in the Borough are far from new and one of the first ‘modal filters’ (the restriction of motor traffic passing through) was created at the junction of Lower Ham Road/Lower King’s Road in c.1968. Whilst another was installed on Bonner Hill Road in c.1978.
The modal filter on Bonner Hill Road (pictured below) helps create one of the Borough’s largest LTNs around Cambridge Road estate. This single modal filter helps reduce motor traffic and by making the roads safer, encourages walking and cycling which can reduce the use of motor vehicles that worsen the Borough’s air pollution problems.
Bonner Hill Road modal filter, installed c.1978
Our research found other LTNs were introduced in the Borough in the 1980s, 1990s, 2000s and, prior to the new LTN trials, the most recent one we have found was created in c.2008 through the installation of a modal filter on Walton Avenue in New Malden at its junction with Burlington Road.
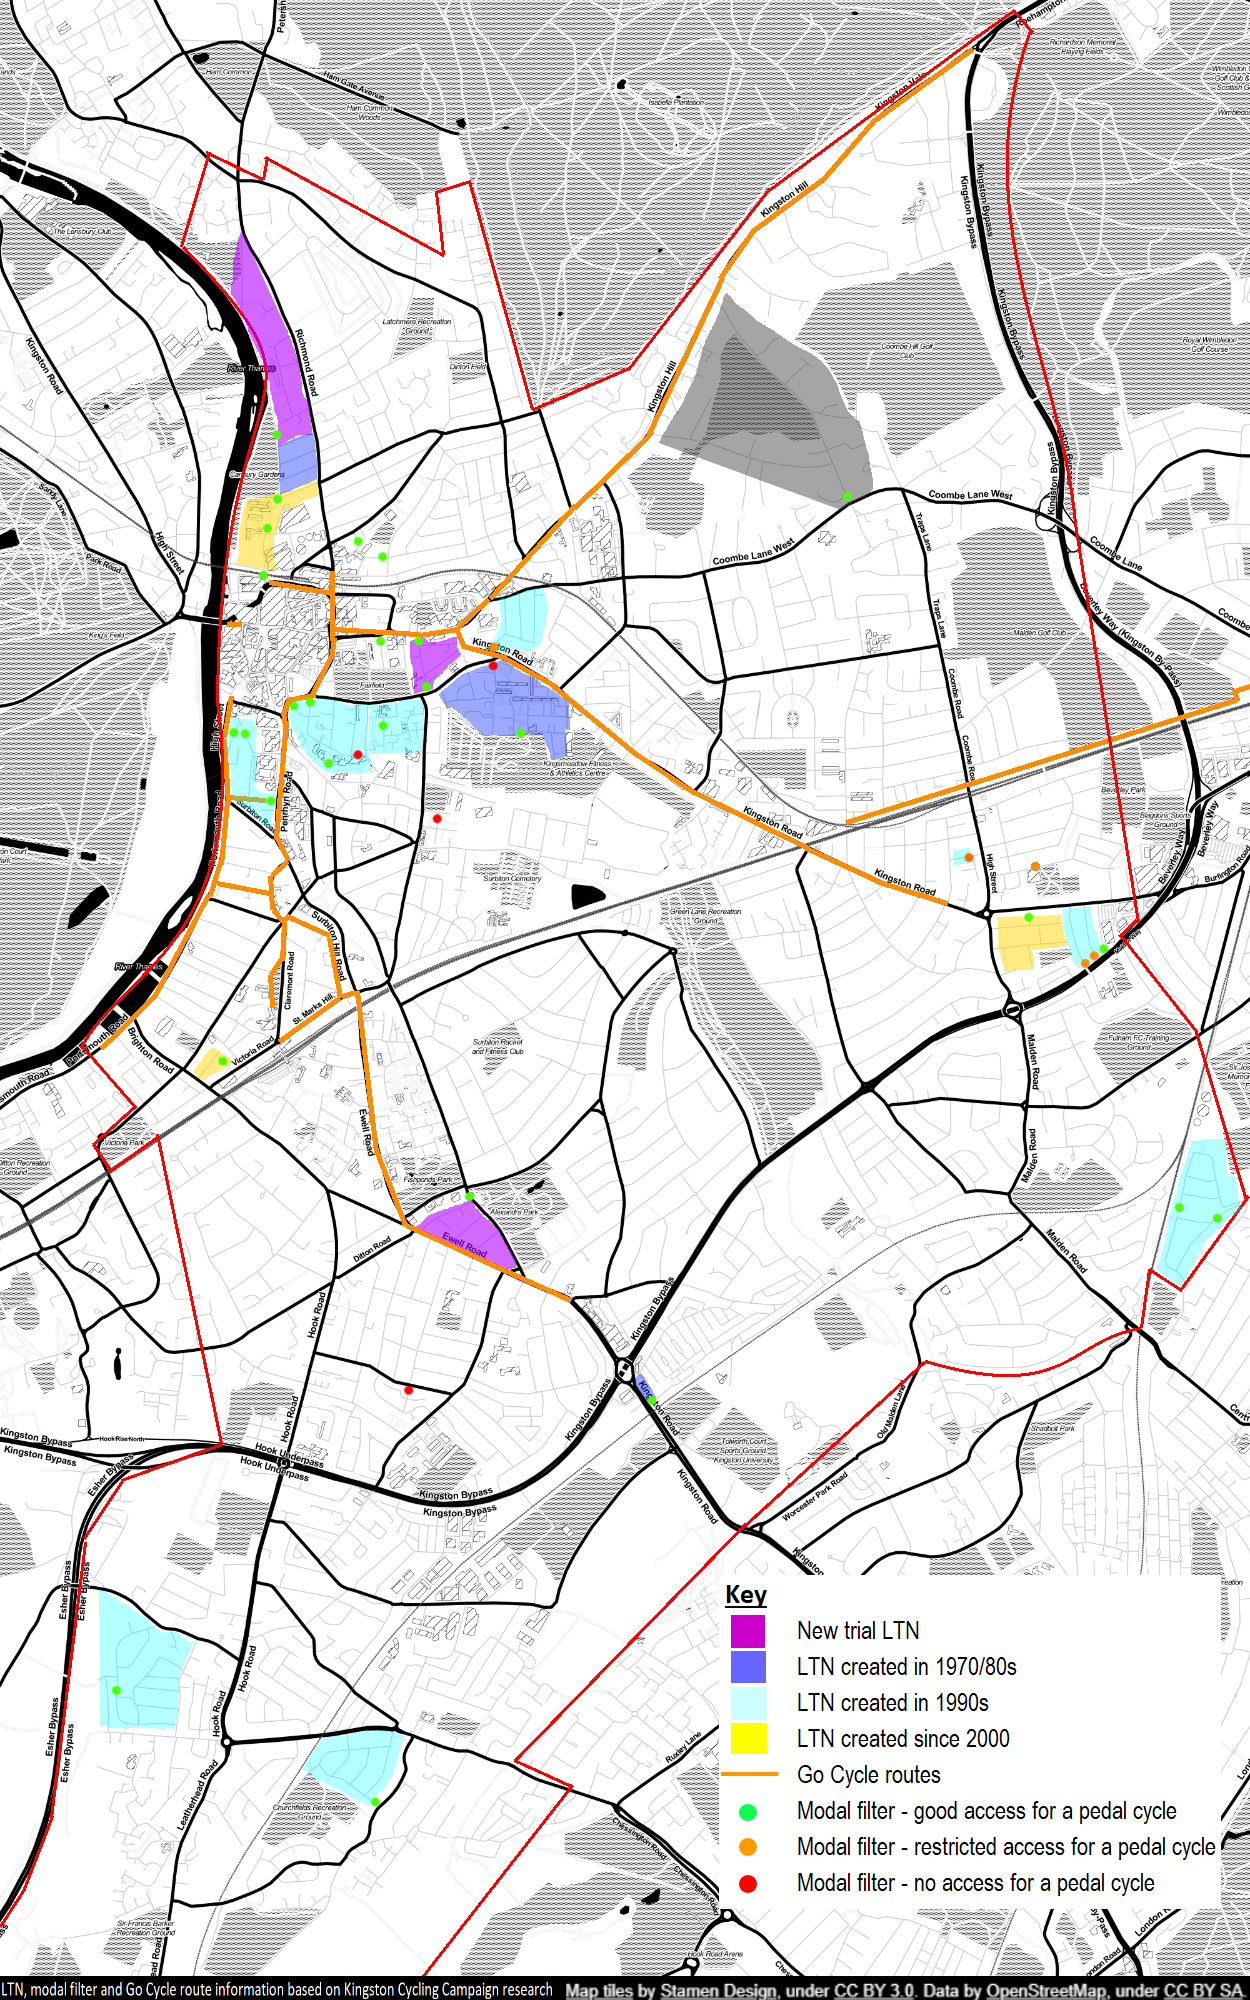
Below you can see our map of LTNs already located in the Borough and which includes the three trial LTNs. This map is based on our own research and whilst we understand it to be correct, please do let us know if there are any omissions or errors.
This map also shows Kingston’s Go Cycle routes (either built, in construction or proposed) and that two of the trial LTNs (Albert Road and King Charles Road) link directly onto the Go Cycle network. This means the residents of these two LTNs not only have safer neighbourhood roads but can use these to connect to safer cycle access along the main roads to many destinations across the Borough. The provision of a network of safer cycle (and walking) routes along main roads that connect neighbourhoods is an absolutely essential part of encouraging walking and cycling. It is also an important part of supporting the accessibility of the Borough for the 29% of households in the Borough that do not own a car.
We have already seen many people enjoy Kingston’s new LTNs (whilst we continue to see people enjoying the ones that have been in place for over 50 years too). We hope that these new LTNs will be made permanent so that their benefits can continue to be enjoyed. We have therefore written to all of the Borough’s Councillors today asking them to support making the trial LTNs permanent and asking them to assist residents in other parts of the Borough with making their roads safer too.
Full list of Low Traffic Neighbourhoods identified in the Royal Borough of Kingston
Low Traffic Neighbourhood
Area
Roads covered by Low Traffic Neighbourhood
Date established*
1
Lower Ham Road (1)
Kingston
Lower Ham Road (part), Eastbury Road, Chestnut Road, Woodside Road
*Our research is based on Traffic Regulation Orders (TRO) administered by Kingston Council. We have used the date of the TRO as the date when the Low Traffic Neighbourhood was established. In some cases, the TRO date may not exactly match where the modal filter (or other measures) were implemented.
As a final note, there are also many Low Traffic Neighbourhoods in the Borough that were established at the time they were built. Examples of this are cul-de-sacs or other estates which were built without provision for through motor vehicles. We have not included these in our analysis and have focussed on those converted to Low Traffic Neighbourhoods through the use of modal filters.
As we reach the end of 2020, we’ve taken a look at the progress that was made on Kingston’s Mini-Holland programme (also known as ‘Go Cycle’) during the year and finish with a look towards 2021.
Kingston to Kingston Vale
The Kingston to Kingston Vale cycle route is the longest in the Mini-Holland programme and started main construction in 2019. It was due to be finished this year but events of 2020 caused this timeline to become unachievable. Despite the difficulties of 2020, during the year the 2-way track along London Road between Queen Elizabeth Road and Manorgate Road was completed as well as the cycle tracks between Manorgate Road and Queen’s Road. Some ‘snagging’ (fixing minor issues) also took place on Kingston Hill and Kingston Vale on stretches of segregated cycle track constructed in 2019.
The reconstruction of the junction between Kingston Hill and Wolverton Avenue finished this year (new and before photos)Cycle tracks added to Kingston Hill (between Queen’s Road and Manorgate Road) finished this year (before and after photos)New 2-way cycle track along London Road completed this year
The only sections outstanding on this route are the junction of Kingston Hill with Queen’s Road and the separate junction with Galsworthy Road. These should be constructed in Spring 2021, and along with finishing the ‘snagging’ items, this will complete the 4.5km route from Kingston Town Centre all the way to the A3 which is close to the Borough of Kingston’s border with Wandsworth.
Surbiton to Tolworth
The Surbiton to Tolworth scheme along Ewell Road will link these two areas with a safer cycle route and started main construction at the beginning of 2020. The majority of the route was due to be completed by the end of the year. However, again timelines have changed and only Phase 1 was completed (St Mark’s Hill to Browns Road). Phase 2 (Brown’s Road to Tolworth Broadway) has had its plans tweaked to fit within a reduced budget provided by TfL and its construction could start early in 2021 subject to TfL’s final approval and funding. Phase 2 could then be completed in 2021 creating a safer cycle route from Tolworth all the way to Kingston Town Centre via Surbiton.
First phase of Surbiton to Tolworth cycle route along Ewell Road completed in 2020. Photos of new and prior layout.
Kingston Station
Kingston Station is the ‘hub’ of the new Mini-Holland network of safer cycle routes and has seen a lot of associated construction activity in recent years. The main progress this year has been continued construction of the Kingston Station bike storage hub which will have space for 450 bikes as well as bike maintenance facilities, lockers as well as a space for a cafe.
Photos of the new cycle and walking bridge which will take people from Kingston Station towards the Thames and the new Kingston Station bike storage hub which will have capacity for up to 450 bikes
Next to the hub is a new bridge which is approaching its final stages prior to opening. This bridge will better link Kingston Station to the Thames and towards Ham. Together with the Low Traffic Neighbourhood along Lower Ham Road and the due to be completed Surbiton to Tolworth link, this will mean there is a 7km safer cycling route (almost!) all the way from the Borough of Kingston’s border with Richmond upon Thames (at Ham Cross) to its border with Epsom & Ewell (near Tolworth).
Both the bridge and bike storage hub should be open by the end of January 2021.
Anything else?
Right at the beginning of the year, the finishing touches were added to the Kingston to Surbiton route (along Penrhyn Road) though that feels a long time ago now…
Outside of the Mini-Holland programme, due to reduced funding and other obvious priorities, there were few infrastructure improvements to the Borough’s cycle network outside of the Mini-Holland (and Streetspace) programme. However, we were pleased that Kingston Council listened to our suggestion and found time to install a dropped kerb next to a ‘toucan crossing’ (for people cycling and walking) near Kingston Station to make it easier for people to get to/from the cycle path underneath Kingston Railway Bridge.
New dropped kerb near Kingston Station making it easier for people cycling to get to/from the cycle track under the railway bridge
Finally, the excellent and very popular New Malden to Raynes Park walking and cycling paths had its first birthday in 2020!
The future
As above, there are bits of the existing Mini-Holland programme to finish off which should be completed in 2021 with the main construction activity due to be along Ewell Road as the second phase of Surbiton to Tolworth is completed. This leaves the proposed Kingston to New Malden cycle route as the only scheme that would remain outstanding….
Kingston to New Malden is the final part of the Mini-Holland programme but is yet to start construction. We understand that this scheme is ready to start construction as soon as Spring 2021 (it received approval from Kingston Council at the beginning of 2020) but it is currently unfunded. We understand Kingston Council continue to lobby TfL for the funding to be provided but until this is happens, the final critical link in the Mini-Holland programme will remain unbuilt. This is despite large housing developments being built along the route as well as its dismal record for safety for people cycling and walking. We will continue to campaign for this vital cycle route and hope TfL will be able to fund it at some point in 2021.
As a final note, we would like to thank everyone involved in the Mini-Holland programme (designers; project managers; construction crews; cycle lane sweepers; Councillors; TfL sponsors; members of the public who have provided feedback; Kingston Cycle Campaign volunteers and many more) for their hard work and contributions during a very difficult year.
In our last update in May, we looked at the impact that Covid was having on Kingston Council’s plans to improve the Borough for cycling and walking. Since then, we’ve seen various Streetspace measures installed around the Borough as well as a restart to the construction of Kingston’s remaining Mini-Holland (or Go Cycle) programme.
This post provides an update on the progress of Kingston’s Mini-Holland programme since construction was paused in March this year due to Covid.
Firstly, why did construction stop?
When Covid lockdown measures were introduced, construction worksites across the country were paused and this included all those in Kingston’s Mini-Holland programme.
After construction was paused, Transport for London (TfL) got in touch with Kingston Council with some bad news….
TfL has been funding all of Kingston’s Mini-Holland programme and during the time that construction was paused, TfL realised that there was going to be a huge hit to its budget as people stopped taking journeys on its transport network. TfL therefore instructed all Boroughs to cease any remaining construction on TfL funded projects until further notice as they sought to save money.
Despite TfL’s request to pause projects, for some parts of Kingston’s Mini-Holland programme, contracts had already been signed with contractors and/or materials purchased with a number of worksites half finished. For these half finished sections, once safe social distancing measures had been implemented by contractors, construction continued to complete these stretches. This is why some limited construction on Mini-Holland projects happened in late Spring.
Following the pause in construction, the Government provided some emergency funding to TfL. TfL then awarded Kingston (along with some other London Boroughs) reduced funding to complete the remainder of the Mini-Holland projects that were already in construction:
Kingston to Kingston Vale (Kingston Hill and Kingston Vale)
Kingston Station hub and bridge
Surbiton to Tolworth (Ewell Road)
Unfortunately, as TfL only provided Kingston with reduced funding compared to the original budget agreed, the existing designs for the remaining stretches of the Mini-Holland schemes had to be revised to reduce costs. This meant that work couldn’t start on these stretches until new designs had been prepared; had new safety audits completed; and then received further TfL approvals. This is the main reason why some Mini-Holland schemes are still not completed.
Kingston to Kingston Vale
This scheme has been in construction for some time. However, since the start of this year, the 2-way cycle track along London Road between Queen Elizabeth Road and Manorgate roundabout was completed. The 1-way cycle tracks were also completed on each side of Kingston Hill between Manorgate roundabout and Queen’s Road.
London Road 2-way cycle track on the Kingston to Kingston Vale route
Apart from snagging (fixing small issues on sections now completed) the three remaining areas to complete the 4.5km Kingston to Kingston Vale route are:
Kingston Hill/Queen’s Road junction
Kingston Hill/Galsworthy Road junction
Section of one way cycle track between Robin Hood Lane and the A3
All the remaining sections of this route have been redesigned (to fit within the reduced budget) and are going through final approvals ready to be constructed. As the remaining sections involve two busy signalised junctions, we expect the Kingston Vale route will now not be complete until 2021. Once complete, the Council will need to ensure that this cycle route is adequately maintained as there are already regular accumulations of leaves and rubbish in the cycle lanes around the Kingston Vale part of the route as well as illegal parking on the new cycle track near Manorgate roundabout.
Surbiton to Tolworth
The first stretch of the Surbiton to Tolworth (between St Mark’s Hill and Brown’s Road) has recently reached practical completion with just snagging and a couple of crossings to finish this section. This stretch provides much needed segregation from cars, vans and lorries.
2-way cycle track on Ewell Road
The first section constructed features good continuous crossings over side roads (where people walking and cycling are given priority crossing roads to people in cars), has improvements to the bus ‘boarder’ design compared to the Kingston Vale route and includes new cycle parking.
As approved by the Council, unfortunately there are areas of shared use on this section (where people cycling have to share with people walking), particularly around the shops near Langley Road. This was done to keep car parking spaces which remains extremely disappointing and means some people cycling will prefer to use the main carriageway whilst others will find sharing with people walking very frustrating. We remain hopeful that this section will be revisted again one day to provide proper segregation.
Shared use area on Ewell Road
On the remainder of the Surbiton to Tolworth route (from Brown’s Road to Tolworth Broadway), this has had to be redesigned to fit in with the reduced budget provided by Transport for London. This redesigned section is currently going through the necessary approvals with TfL before construction can commence.
We understand that this resdesigned route will feature more ‘bolt down segregation kerbs’ vs stepped cycle tracks than originally planned. However, these bolt down segregation kerbs have worked well on the outer parts of the Kingston Vale route where they’ve already been installed. They have the clear advantage that they can be installed at a fraction of the cost of a stepped cycle track and can be added to the carriageway very quickly.
Cycle segregation kerbs installed on the Kingston Hill Cycleway
Kingston Station and hub
Again, more delays caused by funding being paused have held up completion of the widened pedestrian and cycle bridge over Kingsgate Road as well as fit out of the Kingston Station bike hub. However, the Kingston Station bike hub has had its plastic sheeting removed from the exterior and the installation of lighting, security measures and provision of a potential bike maintenance and cafe area has recommenced.
Once complete, the hub will allow the storage of hundreds of bikes and will include areas for cargo and non-standard bikes too (which are often larger and therefore cannot be secured easily to some of the cycle stands around Kingston currently).
Kingston Station bike storage hub being fitted out
Kingston to New Malden
This proposed cycle route was approved by Kingston Council at the beginning of the year. However, due to Covid, funding from TfL has been withdrawn and there’s currently no funding to complete this safe cycle route despite most of the design work having already been completed.
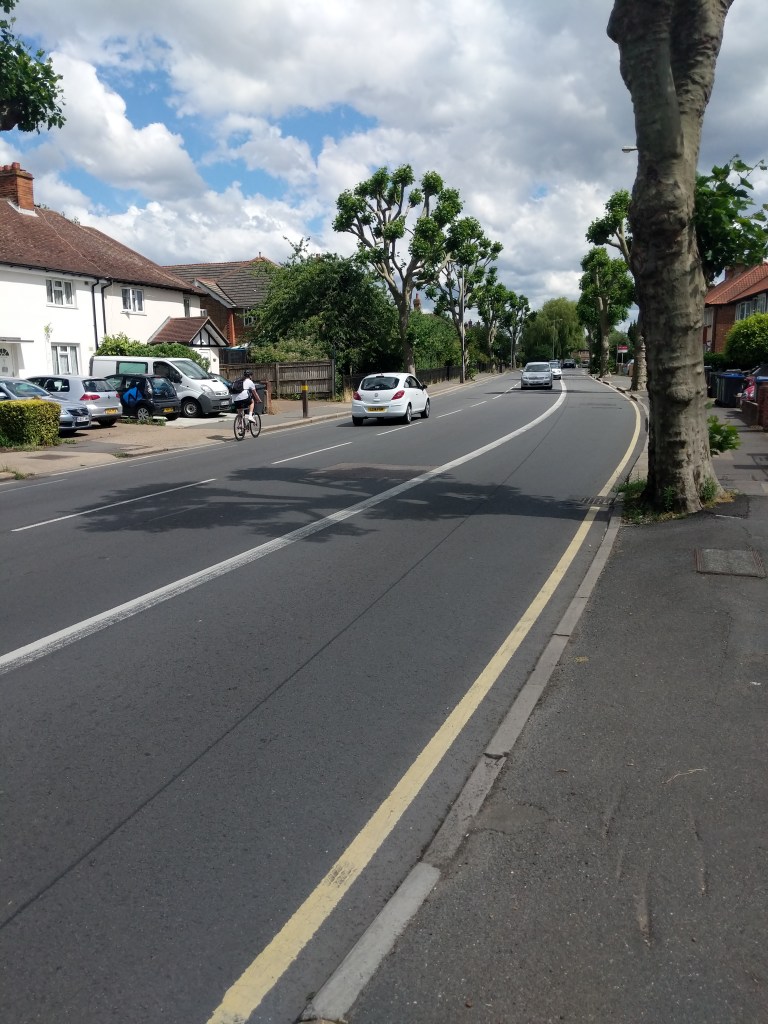
People cycling along the route (Cambridge and Kingston Roads) will therefore continue to be put at increased danger and many will continue to not even think about cycling along this route.
Whilst public transport options are reduced due to social distancing requirements and with climate change an increasing issue, prioritising improving conditions for cycling on these roads is even more important. We hope the Council can obtain funding for the improvements and we wonder whether contributions from property developments could be an alternative source of funds.
Kingston to New Malden route – very poor provision for people cycling currently
Anything else?
Improvements continue on completed Cycleways. Over the past few months, this has included:
Removing dangerous bollards from the middle of the 2-way cycle track on Portsmouth Road
Installation of green Cycleway signage on Wheatfield Way and in Surbiton
Improvements to loading bays on existing Cycleways to make enforcement of illegal parking easier
Spot the new green Cycleway sign on Wheatfield Way
Next steps
We’re looking forward to the schemes currently in construction being completed and hope that the remainder of the Ewell Road Cycleway will start construction soon.
We also want to see funding secured for the vital Kingston to New Malden Cycleway.
As always, if you have any comments or improvements you would like to see, let us know and we can pass them onto the Council. Follow us on Twitter for the latest updates too.
A few people from Kingston Cycling Campaign and Merton Cycling Campaign met on the New Malden to Raynes Park Cycleway this afternoon (socially distanced of course) to celebrate its first Birthday which is due tomorrow, 13 July 2020.
The New Malden to Raynes Park Cycleway
The New Malden to Raynes Park Cycleway (also referred to as ‘Cycleway 31’) has transformed cycling and walking between the two locations since it opened. It opened up previously underused Thames Water land allowing people to cycle and walk between the two locations in a safe environment for the first time. After our successful campaign, the Cycleway was built with separate walking and cycling paths (instead of a single shared path) reducing conflict for people using the route too.
This afternoon we counted over 130 people on bikes in just an hour using the Cycleway with over a third of these being children either cycling with family or friends. There were a similar number of people walking too. This level of usage clearly demonstrates the desire for safe cycle and walking routes.
We expect that this Cycleway would be even more popular if it connected to safe cycle infrastructure at both its ends. We therefore will continue to campaign for the construction of the Kingston to New Malden Cycleway along Cambridge and Kingston Roads.
The proposed Kingston to New Malden Cycleway would pass close to the beginning of the New Malden to Raynes Park Cycleway providing a safer link onto it. The Kingston to New Malden Cycleway was approved by Kingston Council earlier this year but currently does not have any source of funding to start construction. In the meantime, people will continue to be put off cycling on these busy and dangerous roads.